GROUP RESEARCH PROJECT
- id3688y
- Jan 8, 2025
- 15 min read
Greenwich waterfront masterplan brief and site visit
Project: Greenwich Eco-Link: Connecting Communities and Nature
Site: Thames Riverfront between Deptford Creek and North Greenwich Thames Clipper Jetty
Goal: To develop a unified approach to enhancing, promoting and protecting Greenwich's unique river frontage.
Brief: To design a specific part of the whole site developing some of the jetties and piers as welcoming spaces focusing on the sense of arrival, exploring sustainable design strategies that engage both the community and the river.
Principal clients: Thames clippers (opportunities to improve and grow) and Visit Greenwich (promote parts of Greenwich that are underexploited.)
Term 1 outcomes:
A3 Site Analysis Report group work - my group: Andrina, Asma, Ferdush, Luke, Rachel and myself
- Comprehensive site analysis, including site history, Surficial Geology, Ecology, Green and Blue Infrastructure, Politics & Communities, Technology & Sensory Data, transportation, and connectivity.
- Mapping and analysis of current vehicular, cycling, and pedestrian routes to understand connectivity and potential improvements.
- LiDAR & 3D scan results: Including topographical maps, water flow analysis, and vegetation mapping.
- Jetties and Piers Study: Detailed analysis of all jetties and piers, their current usage, and potential for future connectivity.
1:2500 @A0 Research Drawings:
select and combine multiple layers of data relevant for understanding the site. This may include information on site history, geology, ecology, politics, communities, technology, sensory data, materials etc.
Outcome: Digital map, 1:2500 @ A0 plan, 1x section through a chosen pier and any additional drawing that you feel will help you explain the results of your research.
Manifesto/vision Poster: Explain your project in a manifesto poster with maximum 300 words and a vision diagram.
1:2500 @A0 Proposal drawings: Using the research done, show your proposal and intervention on the overall site focusing on developing the site as an ecological corridor.
Outcome: Hand drawing or Digital map, 1:2500 at A0, 1x section and any additional drawing that you feel will help you explain the results of your research.
Digital Scenes: Digital collage showing potential design interventions and concepts across the whole site.
Process Blog:
Documenting ideas and creative journey, capturing design thoughts through a mix of sketches, photos, and notes.
(my lesson notes are at the end of this blog).
Site Visit: 27/09/2024

Site route along the river shore (Thames Path) from Deptford Creek to North Greenwich Pier
Start of walk: 13:18
End of walk: 16:46
(3h28)
MY WORK:
Title page

Using Rachel's drawing of the Thames as a background, I went into Illustrator and aligned the title text with the shape of the river at the start and end of our site. This replaced the old title page (by Asma) with a more simple and creative representation of our report/analysis.

(Previous title page)
Contents page

I layered one of the photos (lowering the opacity to 20%) that I took on our site visit underneath the contents (this is a simplified version of what we had before, designated into parts and chapters to make it easier for the reader).
I chose this image because it shows the River Thames, its shoreline, one of the abandoned historic jetties and a view of Canary Wharf (a commercial area). I thought this represented the analysis of our site quite well.
Introduction


I made title pages for each part/chapter
This just involved writing each section heading and, centre justifying it and then centering the text box in the middle of the pages. I thought this would break up each section and give the reader a break.
Using the brief, I added a summary to Rachel's collage of Greenwich:
The brief: To analyse and research the Greenwich waterfront, focusing on the site's history, ecology, and current urban fabric with the aim of producing a strategy to reconnect communities and nature using the jetties and piers to connect the river to the urban environment and explore ways to reimagin spaces for public and/or ecological use.
Our site
Adding to the luke's diagrams of the site and its context, I wrote descriptions for each.
Location and context: The Royal borough of Greenwich is located in the South East of London, England.
Royal borough of Greenwich: Greenwich is of international significance, being the site of the Prime Meridian, setting the standard for global time-keeping and navigation and with its industrial and maritime history.
Our site: The shoreline walk betweek Deptford Creek and North Greenwich Thames Clipper Jetty (Royal Borough of Greenwich). This spans sections 6 and 7 of the Jubliee Greenway walk and encompasses landmarks such as the University of Greenwich's Old Royal Naval College and the O2 Arena.
Vision statement
I summarised the visions of our group for this project and what we wanted to achieve from our analysis and added it to a site collage of Rachel's.
Vision statement: This report aims to analyse the site's disconnection and find ways to bring people and nature together. We will also explore how jetties and piers can better connect the river to the urban environment and consider ways to re-imagine these spaces for public and ecological use.
Site journey

Using our site scale map, I mapped the route we took during our site visit. I need to reduce the thickness of the route line and lower the opacity of the base map.
Site images

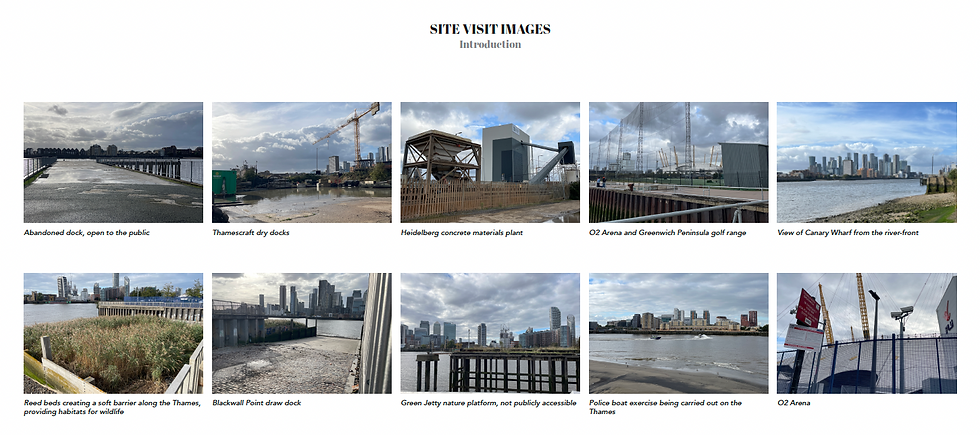
I sorted all of the best images I took from our site visit and then thinned them out to 25 that I thought best captured the site and its surroundings, making this into the 'Site images' page. I added short captions for each image. For the final submission, I will add numbers to each image which will be displayed on a map to show where each one was taken along the site route.

I then took the images of signage and interpretation, as well as artwork installations and collated these into a page for the report. If I have time, I would like to go back to site and see if I can find any more signage to add to this. I also need to write about the lack of signage along the route.

I also took photos of the items I picked up from the foreshore and used these for a "mudlarking" page. For the final submission, I will write about what mudlarking is on the Thames and where it takes place.
History
I chose to research history because I am particularly interested in its unique heritage in time, navigation, maritime, science, exology and transport. I found it very interesting reading about all the different aspects of Greenwich's history, as well as its significance as a part of London and the World's history.
I started off by retrieving some historic maps from digimaps and writing a bit about the history of the site, with some images of old maps and its features throughout history.

I did this for 1890-1990 too but I wasn't happy with the layout of these pages.
AT THIS POINT, I REDESIGNED MY SECTION...
Title page

I provided some of the historical images of Greenwich for Rachel to make a title page for my section (I tried to make my own but it didn't look very good).
I wrote a brief summary for the history of the Royal Borough of Greenwich for the title page and created symbols for the points I will cover later on in the chapter (ecology, time/navigation, maritime and transport).
Time and Navigation history

I used the double page spread to layout each section, with large, high-quality images representing the topic on the left page smaller, more specific images alongside a timeline of the topic on the right. I also added a small diagrammatic map in the bottom right corner to show the location of the topic. In this case, the location of the Royal Observatory in Greenwich Park.
For this topic, I looked at Greenwich's influence in science and navigation, focusing on the Prime Meridian, setting a global standard of 0 degrees longitude running through Greenwich and the use of Greenwich Mean time in time-keeping (particularly in a nautical sense).
Within my research, I found images of the Great Equatorial Building from 1930 and the Airy's Transit Circle telescope from 1850 for the left page. These work well together because they are both in sepia tones.
This timeline starts with an overview of the focus points in the topic - here it is an explanation of the Prime Meridian and Greenwich Mean Time. It then moves into a detailed timeline of the topic (in this section, time and navigation) with images relating to some of the key points along side.
Maritime Greenwich history

For this section, I focused on Greenwich's influence on the maritime scene. This is a large part of why Greenwich's history is so unique.
The layout of this stays the same as the last section on time and navigation (as do the next four sections) with the images on the left page being the same sizes, the timeline on the right and the pictures in the same place and the mini-map in the same position in the bottom right corner.
Within my research, I found images of the Cutty Sark Tea Clipper in 1924 and the Old Royal Naval College in 2024 which I used for the introduction to the Maritime section. These images work well together because they both feature light grey/blue tones.
Again, this starts with an overview of the nautical heritage of Greenwich and moves into the timeline of Maritime Greenwich with images highlighting key points alonside. The map in the corner highlights the area of the Old Royal Naval College and Maritime Museum.
Transport history

This section is particularly interesting, as the earlier modes of transport and routes with the horse-drawn carts and electric trams are what have inspired today's network of buses. It also gave an insight to the historic disconnect between the North and South of the river.
Within my research, I found images of a Thames pleasure boat in 1951 and a Docklands Light Railway (DLR) train in 1987. I used these to represent the various modes of transport along the Thames and around the site throughout the years.
For this map, I combined the transport maps I created for the Transport section later on in the report (with tube lines and bus stops) with the empty map and added Thames Clipper piers. The images alongside the timeline show the development of new modes of transport.
Jetties and docks history

With this project's focus on docks and jetties, it was important to look into the history of their uses and installations/refurbishments.
Within my research on the jetties and docks, I found images of the Greenwich Steam Ferry in 1837 and Crowley's Wharf in 2018. This shows the difference between one of the piers in use and another of the piers in its current, abandoned state.
It was quite difficult to find any information on the use and history for some of the docks, with a few of them not even having records of their names. It was however, interesting to learn about the influence they had on the industrial development of Greenwich with the information I could find - particularly in the use of wharves.
Ecological history


This looks at the history of Greenwich in an ecological context. Using maps and images,I focused on Greenwich Park and the North Greenwich Peninsula Ecological Park, creating a timeline for each with key dates.
Key findings:

This page summarises my key findings from the history chapter with points that we should take forward with our design. I also found a section of the National Maritime Museum that fit well with this page.
Transport
I had already started to look into transport before we divided the sections between us, so I worked with Luke on this part.

This was my initial research on transport around the site. I looked at the train lines and bus stops, bridges and foot tunnels and boat services.
Similar to my initial historical pages, I wasn't happy with the layout and our group ended up changing base maps, so I redesigned these pages to fit.

This maps the underground and overground rail lines through and around the site - highlighting how most of the transport links are more toward central London. I also found images of the closest train/tube stations to our site.

This map shows all of the bus stops in the surrounding area (I accurately mapped each stop indivually using the TFL website and google maps as a reference onto our base map in illustrator. this took quite a while...
I also found images of the buses that run in the local area covering different routes.

This shows the boat piers in use by Uber boat Thames Clippers (to go with Luke's map of the routes they take.
Other sections:
I did a lot of reformatting with the work that I was sent by other people - making sure images and text were in line, changing font sizes and correcting mistakes within the work, and moving images to make the pages flow better (particularly with the environemtal factors section)
I provided the images of different paving types along the route for the blue and green infrastructure section.

Design guidelines (historical)
My guideline: Creating more interpretation and signage explaining the maritime, scientific and ecologial heritage of the area along the Thames Path site would engage visitors and encourage them to reflect on and appreciate the unique story of Greenwich and the rivers Thames through different lenses.
SWOT analysis for history
Strength: The rich and unique history of Greenwich and its global influence in the maritime, transport, science and navigation scenes with the Cutty Sark, Prime Meridian, Greenwich Mean Time and the first suburban railway in the world.
Weakness: There is a lack of information on site about the area, particularly alongside the wharves and where the cable and gas works had operated on the Greenwich Peninsula which has had such an industrial influence on London in the past.
Opportunity: There is a chance to engage and educate people about how the landscape has changed throughout time, to fit the needs of its inhabitants such as wildlife, use of land for farming, naval transport, various industries, residential space and tourism.
Threats: With the popularity of the Cutty Sark, the Maritime Museum and the Royal Observatory, the focus of Greenwich’s history shifts towards the maritime element it’s historic industrial significance is somewhat lost. This however, makes up a huge portion of Greenwich’s heritage and how the landscape was changed.
Presentation: 01/11/2024
Reflection and personal thoughts on the group work and presentation
It has been extremely difficult to work with this group - especially concerning communication among us. Even with setting up a WhatsApp group for contacting each other, the communication was not great. Rachel set up a shared OneDrive folder where we could all upload our work, so we could see what everyone else was doing and I could collate it all into one file. Many people would not upload their work and even after being asked multiple times (and them telling us they would upload it "in a bit" or "when they got home", the work would not get uploaded, or would be 1-2 days later than agreed. The saying 'you can lead a horse to water, but you can't make it drink' comes to mind. I understand people have things going on, and I have had a quite few personal issues outside of university, but it is very difficult to appreciate this when relying on others to get their part of the work done. Rachel was very efficient with the work, producing a lot of good research on ecology and green/blue infrastructure - her section was complete in a good time-frame and she added pages here and there to further enhance it, but I appreciate that her work was ready and uploaded with plenty of time before submission for me to add it to the file.
I could have spent more time on my history research if people had followed the layout and colour pallette before sending me work to collate. Instead, I had to reformat quite a bit and move things around. Our group was unable to finish the design guidelines and proposals because indivudually, not eveyone had finished the work on their designated sections. We had agreed to upload everything at the latest by Thursday night before the presentation, but I was still being sent pages to put together 5 minutes before we had to present.
We had an unfinished report when presenting, which felt very unprofessional and disappointing - especially since we had guests who had taken time out of their busy schedules to give us feedback. We also ran over time, because we each took too long presenting and I felt very bad for Luke, because he wasn't able to present the transport section and also disappointed that we weren't able to show the design guidelines and we had made. I was trying to summarise the highlights of my history section because I knew we had a long presentation to get through, but I should have summarised more efficiently to save time.
I understand that this experience was supposed to teach us what it can be like in practice, having to rely on others to get work done, with people sharing different opinions and disagreeing, but it has caused me a great deal of stress and has honestly altered my opinions on some of the people in our class. I do not think the work was split evenly between the group and some people had to pick up some of the work that wasn't being completed by others.
Notes from general feedback from the presentation
Double page spreads loses a lot
Why did we research each element? What did it provide?
What did we learn from it?
Why does the point matter? Why is it relevant?
Dos it need to change/shift?
Early thoughts about design - save for later
Presentation skills - eye contact, ask questions, engagement, key bullet point cards/notes, don't talk to the screen
Analysis:
Lay out groundwork for design - baseline
Make something of the data
So what? Why? What does this impact?
As far as we can understand...
What do we need to do about each element?
What/why do we need to change?
Publicly available data/personal experience
Engagement with the river
Show disconnection
Effects of boats on the river banks
Cross reference
Summary
More spatial and qualitative data
Solutions:
What are we trying to solve?
Trade-offs
Address the issues - then propose the solutions
Pose questions that set up the design element
Feedback forms from guests:


Notes on feedback specific to our group:
Uses and activity in action - how do people use the space?
Images of land use
How does this impact design?
Artificial intelligence:
Why did AI create these responses?
What can we observe from the images/assumptions
What prompts have been used and how do we adjust these to fit?
Garbage in = garbage out
LIDAR - why do we need to scan? What can we observe from it?
Biodiversity:
Qualitative data
Biodiversity action plan
Evidence-based approach
Cataloguing - with spatial mapping
Environmental factors:
Too general
How does it affect the site?
Proposals:
Don't try to solve everything
Heirarchy
LESSON NOTES (throughout term 1):
Things to consider:
Connectivity to the river
Transport connectivity
Taxis, cars, buses - inland
Additional custom - river taxis
Continuity of footpath from Deptford to Thamesmead
Mechanisms
Development policies/policy documents
Briefing documents
Planning process
Physical designs
Designed elements along the riverfront
Footpath (humans)
Highly speculative
River water
Tides - position of the moon
Relative position of sun/moon/earth
Rise and fall

Eliptical
High fluctuation - Spring tide
Low fluctuation - Neap tide
Project = half cycle
Autumn equinox - 21/09/2024
Spring equinox - 21/03/2025
The moon is closer to the earth, resulting in exceptionally high/low tides.
Mudlarking: Uncovering of objects
Hygiene and health - Do not eat on the foreshore, wear gloves
Guided tours
Water management:
SuDS (sustainable drainage systems)
Bioswales
water quality/management
London is a sealed surface (impervious) - not much rain can penetrate the ground
One pipe system - all water and waste water ends up at the sewage treatment plant which becomes overwhelmed, releasing it into the Thames.
Super sewer - infrastructure
Journey of the water and treatment
Reduce impact and flow
Clipper speed creates a swell
Accessibility
Width of the path
Narrows/wider areas
Research
Qualitative (impact/materials choice/experience)
Quantitative (tall/wide/dense/depth)
Historical use
Sections
River wall structure
Land grab
Undercroft
Technology
Slam scanner
Gaussian splat
Apps for scanning: Polycam, Luma, Scaniverse
Psuedopublic/psuedoprivate:
Something that looks public, but is private or something that looks private but is public
Public/private
Boundaries
Week 2 presentation
Brief
Enhance and protect Greenwich's riverfront
Promote carbon neutral travel
Improve connectivity
Revitalise underutilised spaces
Create new pier developments
Integrate historical, cultural and ecological values
Why is the site unique?
Deliverables:
site analysis
spatial strategy + masterplan
Design guidelines
Site selection and design
Research
Site history
Ecology
Blue and green infrastructure
Connectivity
Urban character and land use
Communities
Transport
Landmarks
Ownership
Public realm + street furniture
Visual and physical accessibility
Site analysis
Local influences beyond the site and beyond the boundary
Regional
London
Wider context
Site + surroundings
Views, airport
Study area
Connectivity
Landmarks
Key buildings
Selected site
Criteria
Detail
Furniture
Materials
Species
Fences
Obstacles
Process - from analysis to design
Ensure insights/analysis directly informs and shapes future design in a meaningful and relevant way
How do the urban, natural, social and cultural layers of the site intertwine?
Key focus points:
Waterways and blue infrastructure
Ecological corridors
Parks and public realm
Topography
Connectivity and circulation
Urban form and land use
Activities and programming
Site history and character
Key landmarks and attractions
Existing communities and future users
Layered site analysis
Research drawing
Vision
Proposed spatial strategy and guidelines
Site selection and design
Clarity
Celebrate site's unique qualities
Context influence across scales
Interconnected systems
Tools + technology
Site visits
Technology
Narrative of report
Report layout
PART 1 - INTRODUCTION
Chapter 1 - Understanding the brief
Summary
Brief objectives
Chapter 2 - Site journey
Intro to the site
Site journey collage
Chapter 3 - Vision statement
Chapter 4 - Site division
Chapter 5 - Methodology statement (Site visit, desktop research, data...)
PART 2 - UNDERSTANDING THE SITE
Chapter 1 - History
Timeline with key points and expanded highlights
Role of Greenwich in London - economic
Thames water management
History of transport
Key findings
Chapter 2 - Greenwich today
Site context - base map, what's there? Landmarks (wider scale)
Site characteristics (wider scale): Green space, residential, industrial, waterways, commercial, education
Urban form: Figure ground map
Key infrastructure
Land use
People and communities
Key findings
Chapter 3 - Environmental analysis
Green and blue infrastructure
Ecology (wider scale)
Biodiversity
Environmental factors: sun, shade, lighting, pollution, waste, water, wind, tide
Key findings
Chapter 4 - Connectivity
(Wider context)
Arriving at the site (transportation network and micro mobility)
Thames clippers
Active networks (cycling/pedestrian)
Timings
(Zoomed in)
Public space usage
Transport, water, active networks
Water frontage access
Piers and jetties (active/non-active), usage (numbers)
PART 3 - FINDINGS SUMMARY
Chapter 1 - Key findings
Chapter 2 - SWOT (Strengths, weaknesses, opportunities and threats)
PART 4 - PROPOSAL (GROUP)
Chapter 1 - Design guidelines
Activation
Connectivity
Chapter 2 - Proposed strategy
Goals
Strategy - diagrams
Design guidelines (examples)
Connectivity
Ensure path is continuous and well marked
Priorities public access
Avoid isolating parts with barriers
Ecological integration
Use native plants suited to the tidal nature
Introduce flood-resistant green infrastructure
Avoid hard, impermeable surfaces
Public space and amenities
Create interaction zones
Ecological corridors with ample seating
Integrate historical and cultural information points
Avoid over-designing/over commercialisation
Shade and microclimate
Use a diverse planting strategy
Focus on species that can tolerate exposed/windy conditions
Avoid artificial shading


Comments